Trend Reporting
Table of Contents
Trend Reporting helps you:
-
Gain access to insightful trend analysis through custom queries.
-
Measure the success of security programs through SD Elements
-
Make strategic business decisions that can increase your security posture, productivity, and growth.
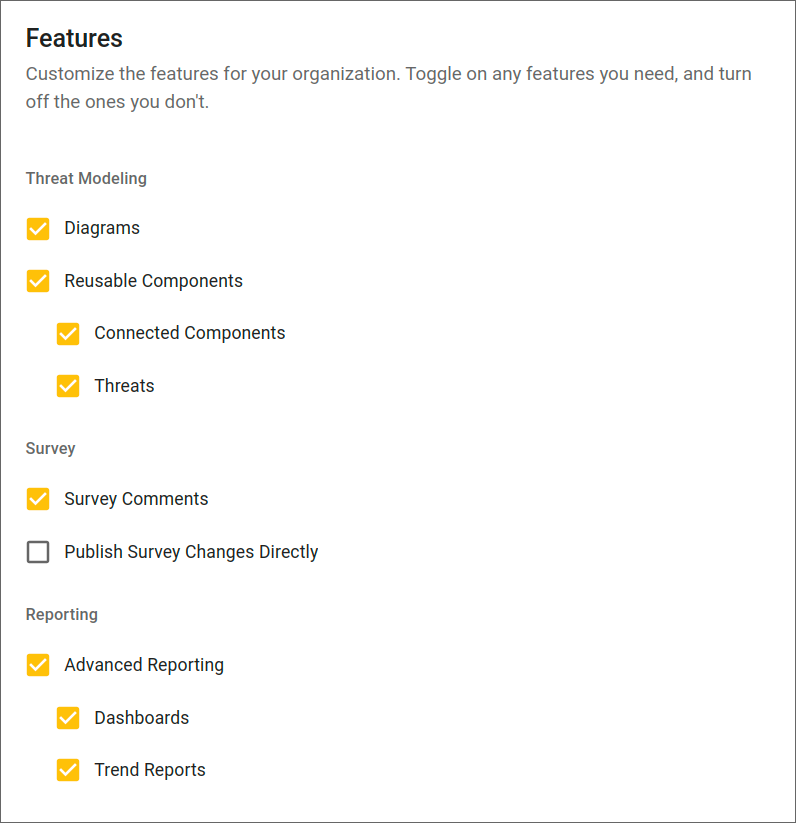
Trend Reports Feature Flag
-
The feature flag is enabled by default. You can find this in the menu, navigate to Settings → Features
| In order to access this page, a user’s role must have the Manage Features permission enabled |
Prerequisites:
-
The user has appropriate permissions to access Advanced Reports, Trend Reports, and Dashboards. In the menu, navigate to Manage → Global role → Reporting.
-
The user is working with a container deployment of SD Elements.
| Trend Reporting is only available on container deployments of SD Elements. |
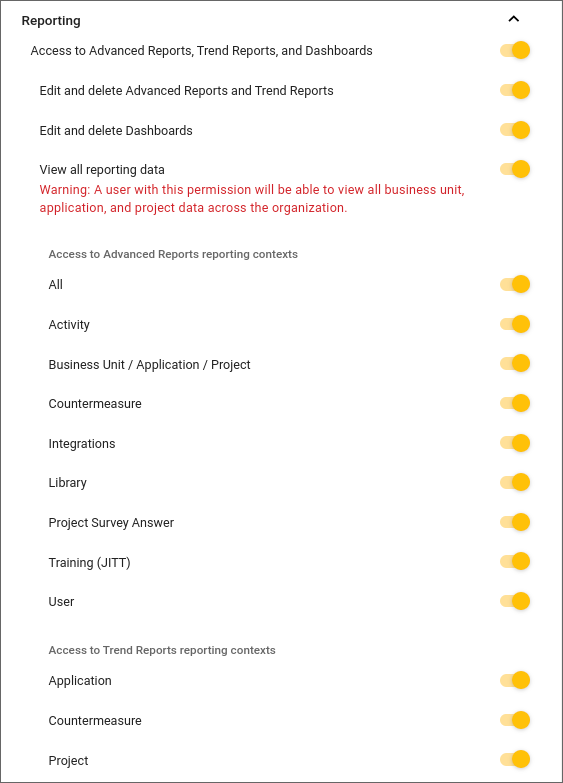
Access to Advanced Reports, Trend Reports, and Dashboards |
Allows the user to navigate to the Advanced Reports, Trend Reports and Dashboard pages. |
||
Edit and Delete Advanced Reports and Trend Reports |
Allows the user to edit or delete trend reports that are not created by them. |
||
Edit and Delete Dashboards |
Allows the user to edit or delete dashboards that are not created by them. |
||
View all Reporting Data |
Allows the user to view all accessible reporting data.
|
||
Access to Trend Reports reporting contexts |
Allows the user to access specific reporting contexts so they can create and view specific types of reports. |
Contact sdesupport@securitycompass.com for more information.
Trend Reports Page
This page contains access to all your saved reports and allows you to build a new report from a blank template. Anyone with permission to view this page will have the ability to see all existing reports and data across all Business Units, Applications, and Projects.
Trend Report Details
A trend report has the following properties:
-
Title: A required field that will be the title of the report (character limit: 128)
-
Description: A short summary of the report (character limit: 255)
-
Reporting Context: Refers to the specific object that influences the analysis and presentation of the available data in a report. There are three specific reporting contexts to choose from: Application, Countermeasure, and Project.
-
Time Frame: The level of granularity the user would like the output of the report to be. Please note that there are limits in place pending on the chosen granularity.
-
When a user selects Daily, a maximum of 30 days is allowed to be displayed on visualizations and selected on the calendar
-
When a user selects Weekly, a maximum of 16 weeks is allowed to be displayed on visualizations and selected on the calendar
-
When a user selects Monthly, a maximum of 24 months is allowed to be displayed on visualizations and selected on the calendar
-
When a user selects Quarterly, a maximum of 8 quarters is allowed to be displayed on visualizations and selected on the calendar
-
When a user selects Yearly, a maximum of 2 years is allowed to be displayed on visualizations and selected on the calendar
-
-
Date Range: The range of which you would like to capture in the output of the report. Please be mindful of limits.
-
Measures: Contain numeric, quantitative values that you can measure. Some measures can be predefined aggregations.
-
Filters: Provide the ability to dissect and show specific subsets of your data that you want to analyze. Filters allow for AND/OR logical comparison operators. To use an “OR” operator, simply add a filter and you will be presented with additional “OR” inputs. To use “AND” operators, click
+after inserting your first filter and you will notice the separation of filter inputs by an “AND”. The order of operations is based on the order of logical operators. Each block is executed left to right, with the inside of the block evaluated for “OR” inputs.You must select logical comparison operators from the dropdown list. Do not enter comparison operators by typing them in. After constructing your filter, push Enter on your keyboard to apply it. You will receive the error "Invalid Token" while executing a trend report if it takes longer than 60 seconds to execute. Add additional filters to the report to reduce the number of returned results. -
Chart: The type of visualization you want to view your report in. Current visualizations include: Table, Pie, Number, Horizontal Bar, Stacked Vertical Bar, Line. The visualization that is selected upon creation or saving will be what renders in the UI when viewing the report.
-
Create: The ability to create the report where it will then be saved.
Building A Trend Report
To create a trend report, follow the steps below:
Steps:
-
Open the menu option Reporting→Reports.
-
Click the plus button. A dialog opens.
-
Select a Trend Reports on the left nav.
-
Select a trend report template.
-
Choose a trend Report Context:
-
This is a required step before a user can start building out their report. It identifies the foundational context from which the data is to be pulled. Available contexts include:
-
Countermeasure: Is a context primarily focused on delivering insights into the status of Countermeasures within Projects as well as any relations they may hold across Threats, Weaknesses, and Components.
-
Application: Is a context primarily focused on delivering insights into the statuses of Applications
-
Project: Is a context primarily focused on delivering insights into the statuses of Projects
-
-
-
Fill in the fields.
-
Click Create.
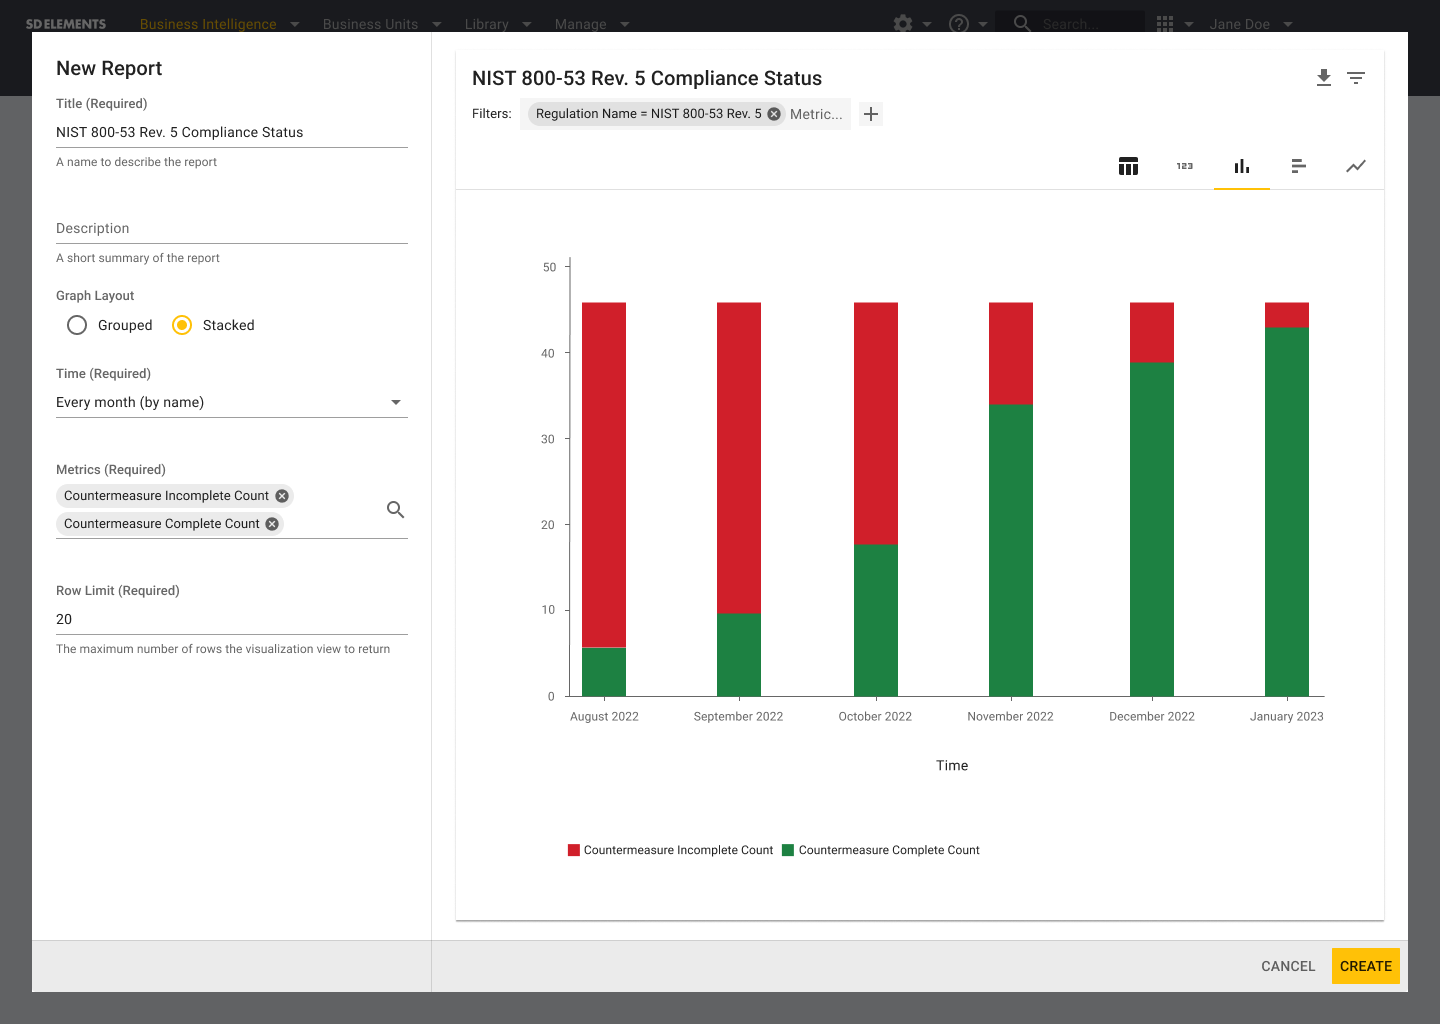
Once the report is created, you will immediately be taken to the trend reports list page.
View A Trend Report
To view a trend report, follow the steps below:
Steps:
-
Open the menu option Reporting→Trend Reports.
-
Click the name of the report that you want to view.
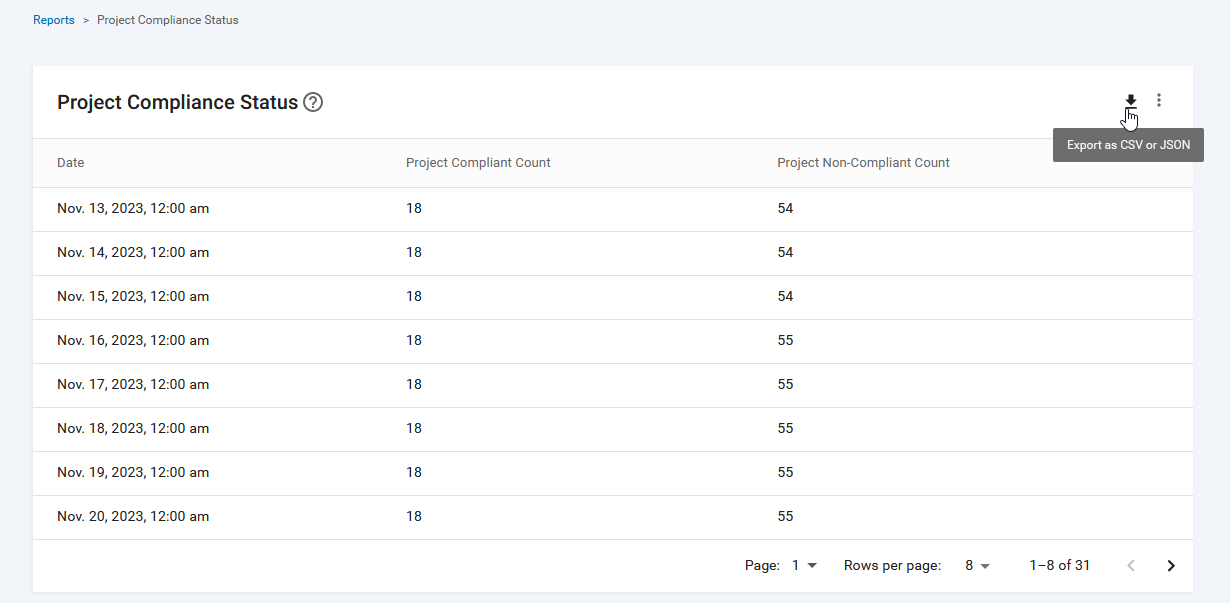
Trend reports are rendered based on the specified chart type.
Additionally, reports can be exported to either CSV or JSON by clicking on the download button at the top right:
Edit A Trend Report
To edit a trend report, follow the steps below:
Steps:
-
Open the menu option Reporting→Trend Reports.
-
Use the search feature if you need to find the trend report in the list.
-
Hover over its row on the far right, and click the pencil icon (Edit). A dialog opens.
-
Update the details of the report.
-
Click Save.
Changes to the report are immediate.
Delete A Trend Report
To delete a trend report, follow the steps below:
Steps:
-
Open the menu option Reporting→Trend Reports.
-
Use the search feature if you need to find the trend report in the list.
-
Hover over the report’s row on the far right, click the trash can icon (Delete). A dialog opens.
-
Confirm that you understand that the report will be removed.
-
Click Delete.
The report is deleted immediately.